Can You Trust a Model's Probability Score? A Beginner's Guide to Calibration in Machine Learning
Learn what probability calibration means, how to read a reliability diagram, and how to fix over- or under-confident classifier scores safely.
A classifier often returns a score such as 0.92 next to its answer. Many teams read that as "92% sure." But the number is only trustworthy if the model is calibrated, which means its scores match how often it is really right.
This guide explains probability calibration in plain English. You will learn how to check it, how to fix it, and where the fixes stop working. It uses the official scikit-learn documentation and two research papers as evidence.
Article index
- What calibration means
- Why models drift away from honest scores
- How to check calibration
- How to fix calibration
- A worked example
- What about language models?
- Limits, privacy and security
- Common mistakes
- Recap
- Research Sources
What calibration means
Calibration asks a simple question: when the model says 80%, is it right about 80% of the time? The scikit-learn guide puts it this way. For a well-calibrated binary classifier, about 80% of the samples scored near 0.8 should truly belong to the positive class (scikit-learn probability calibration guide).
A classifier is a model that sorts items into classes, such as "urgent" or "not urgent." A probability score is the number it outputs for each class. In scikit-learn, that number comes from a method called predict_proba.
Calibration is different from accuracy. Accuracy counts how many answers are right. Calibration checks whether the confidence attached to those answers is honest. A model can be accurate and still badly over-confident.
This matters whenever a score drives an action. Examples include "auto-approve above 0.95," "send to a human below 0.6," or "show a warning above 0.3." If the scores are skewed, every one of those thresholds is set on bad evidence.
Why models drift away from honest scores
Different model types fail in different, predictable ways. The scikit-learn guide compares several (scikit-learn guide):
- Logistic regression is often well calibrated by default, according to the guide.
- Gaussian naive Bayes pushes probabilities toward 0 and 1. The guide says this happens because its assumption that features are independent fails when features are correlated.
- Random forests avoid scores near 0 and 1, which gives a sigmoid (S-shaped) curve.
- Linear support vector machines show an even stronger S-shape, which the guide calls typical of maximum-margin methods.
Deep neural networks have their own problem. Guo and colleagues reported that modern networks, unlike those from a decade earlier, are poorly calibrated (Guo et al., "On Calibration of Modern Neural Networks," ICML 2017). They found that depth, width, weight decay and Batch Normalization all affect calibration.
The practical lesson is that you cannot assume a score is honest because the model is accurate. You have to measure it on data the model has not seen.
How to check calibration
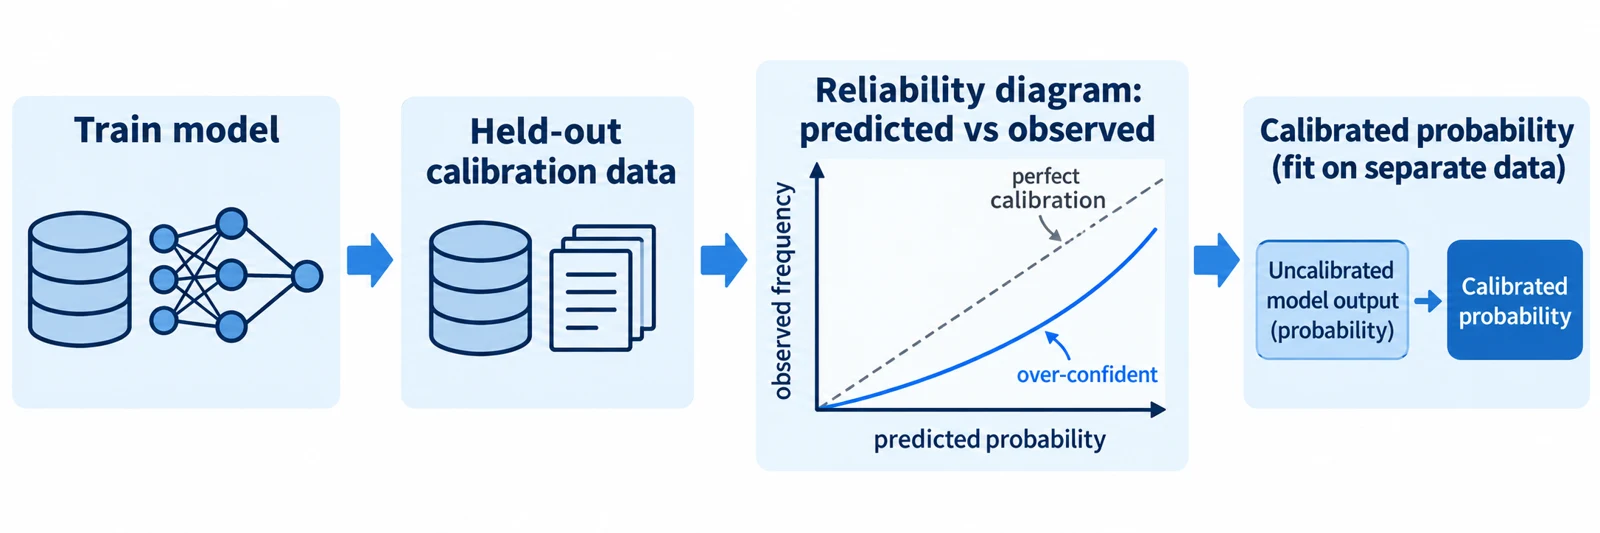
The standard tool is a reliability diagram, also called a calibration curve. It groups predictions into bins by score. For each bin it plots the average predicted probability against the fraction of cases that were actually positive. A perfectly calibrated model lies on the diagonal.
In scikit-learn, calibration_curve returns those two lists of numbers. It handles binary classifiers only. It has a n_bins setting (default 5) and a strategy setting: uniform makes equal-width bins, and quantile puts equal numbers of samples in each bin. The documentation warns that larger bin counts need more data, and that empty bins are dropped (calibration_curve documentation).
Shape tells you the problem. An S-shaped curve points to an under-confident model. The scikit-learn example shows this for a linear support vector machine. A transposed S-shape points to over-confidence, which the same example shows for Gaussian naive Bayes (scikit-learn calibration curve example).
You can also use a single number. The Brier score is the mean squared gap between predicted probabilities and actual outcomes. Lower is better, and for binary problems scikit-learn scales it to the range 0 to 1 (brier_score_loss documentation). Log loss is a related score that punishes confident wrong answers heavily.
Use these scores with care. The scikit-learn guide warns that they mix calibration with discriminating power. A lower Brier score does not prove better calibration, because it could come from a model that separates the classes better.
How to fix calibration
The fix is a small second model, called a calibrator, that maps raw scores to better probabilities. It is trained on top of your classifier. The key rule from the documentation is that the calibrator must be fit on data independent of the classifier's training data. Otherwise it learns from over-confident outputs and stays too close to 0 and 1 (scikit-learn guide).
Scikit-learn documents three methods (CalibratedClassifierCV documentation):
- Sigmoid (Platt scaling) fits a two-parameter S-curve. It suits small datasets, and the guide says it may be preferred for very uncalibrated models on very imbalanced data.
- Isotonic fits a flexible step function that only goes up. It can fix any monotonic distortion, but it overfits on small calibration sets. The guide says it performs as well as or better than sigmoid with more than about 1,000 samples.
- Temperature divides a multiclass model's raw outputs (logits) by one number, T, before the softmax step. The documentation says it was added in scikit-learn 1.8. It does not change which class ranks first, so accuracy stays the same.
The temperature idea comes from Guo and colleagues, who called it a single-parameter version of Platt scaling that "works surprisingly well" on most datasets they tested (Guo et al. 2017).
There are two ways to supply calibration data. CalibratedClassifierCV can use cross-validation, which splits your data into folds so every score is calibrated on cases the base model did not train on. Or you can calibrate an already-trained model by wrapping it in FrozenEstimator. In that second case the documentation says you must make sure the training and calibration data do not overlap. Nothing checks it for you.
What does calibration buy you? The scikit-learn example reports that calibration improved Brier and log loss but barely changed precision, recall or F1, and that ROC AUC stayed essentially unchanged (calibration curve example). For example, on that page's synthetic data, uncalibrated Gaussian naive Bayes had a log loss of 0.783. With isotonic calibration it was 0.371. These are the page's reported results on its own data, not a promise for yours.
A worked example
This is an illustrative scenario. I did not run it, and the numbers are invented to show the logic. Imagine a team that scores incoming support emails for urgency. Emails scoring 0.90 or higher are routed straight to an on-call engineer.
Prerequisites: Python, and scikit-learn 1.6 or later for FrozenEstimator. The scikit-learn guide I opened documents version 1.9.1. You need labeled emails split three ways: training, calibration and test. Keep the three sets separate.
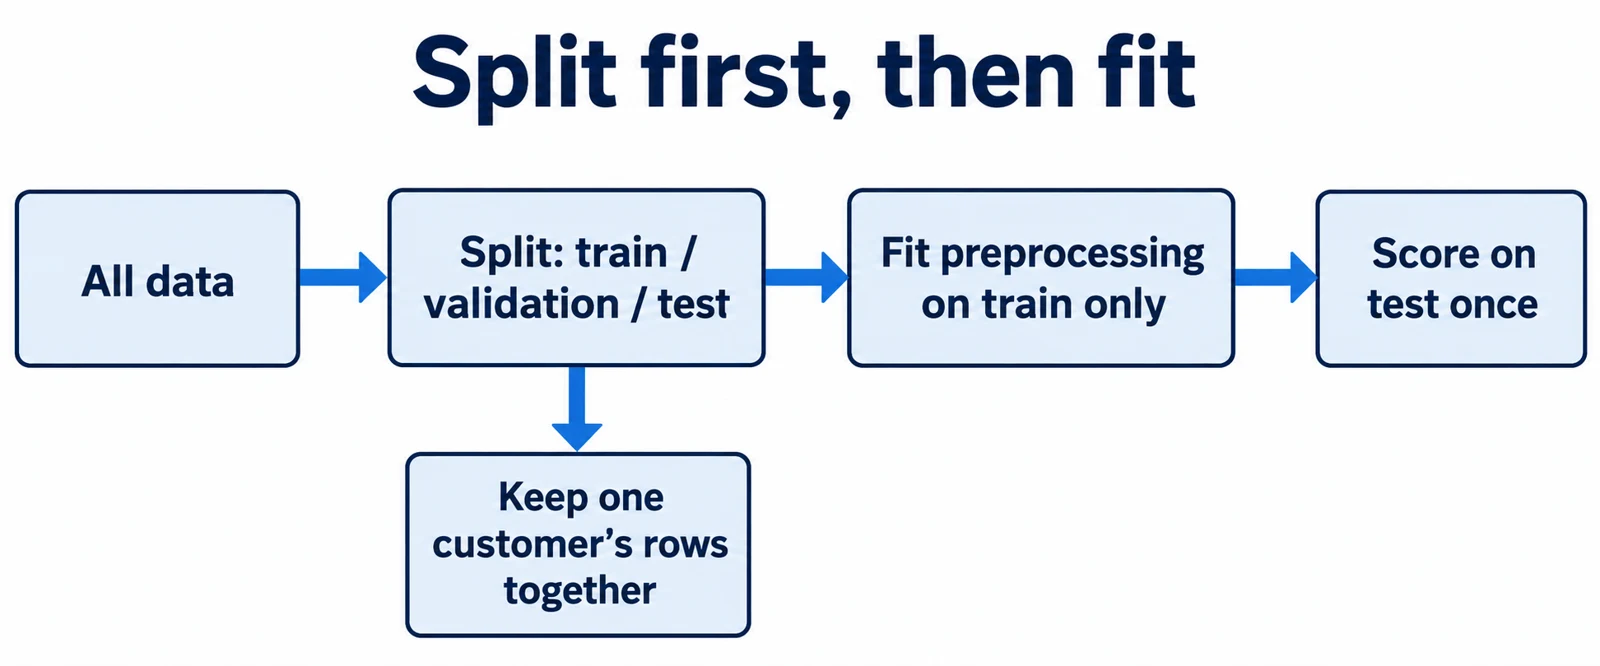
- Split the labeled emails into three sets. Input: all labeled emails. What happens: you set aside training, calibration and final test sets, with no email in more than one. Result: three disjoint sets. Why it matters: the calibrator must not see the data the classifier trained on, and the test set must stay untouched until the end. If emails come from the same customer thread, keep each thread in one set.
- Train the classifier on the training set only. Input: training emails and labels. What happens: the model learns to score urgency. Result: a fitted model that returns raw scores. Why it matters: this is the model whose confidence you will examine, not yet trust.
- Draw a reliability diagram on the calibration set. Input: scores and true labels for the calibration emails. What happens:
calibration_curvebins the scores. Result: suppose the 0.90 bin shows only 70 of 100 emails were truly urgent. That is an illustrative figure, not a measurement. Why it matters: it shows the model is over-confident right at the threshold that triggers paging. - Fit a calibrator. Input: the frozen classifier and the calibration set. What happens: the calibrator learns a mapping from raw score to observed frequency. Result: a wrapped model with adjusted probabilities. Why it matters: with a few hundred calibration emails, sigmoid is the safer choice per the documentation. Isotonic needs far more.
- Compare on the test set. Input: test emails scored before and after calibration. What happens: compute Brier score, log loss and a new reliability diagram. Result: you expect lower Brier and log loss if calibration worked, with ranking metrics such as ROC AUC nearly unchanged. Why it matters: this is your honest, final check.
- Re-pick the threshold. Input: calibrated scores and the cost of a missed urgent email versus a false page. What happens: you choose the cut-off from the calibrated curve, not from habit. Result: a threshold with a known meaning. Why it matters: "0.90" now stands for a rate you measured.
The code below shows the pattern, based on the API shown in the documentation. It is a sketch to adapt, not tested output. The variable names are placeholders.
from sklearn.calibration import CalibratedClassifierCV, calibration_curve
from sklearn.frozen import FrozenEstimator
from sklearn.metrics import brier_score_loss

model is already fitted on the TRAINING set only
calibrated = CalibratedClassifierCV(FrozenEstimator(model), method="sigmoid")
calibrated.fit(X_calib, y_calib)          # calibration set only
proba = calibrated.predict_proba(X_test)[:, 1]
print(brier_score_loss(y_test, proba))
prob_true, prob_pred = calibration_curve(y_test, proba, n_bins=5)
How to check the result: the numbers in prob_true should sit close to those in prob_pred. If they do not, check three things in order. First, confirm the calibration and training sets do not overlap. Second, try fewer bins if some are empty or tiny. Third, if you used sigmoid and the curve is still bent, try isotonic only if you have well over 1,000 calibration samples. This step is not destructive, and your original model stays unchanged, so rollback is simply using the unwrapped model.
What about language models?
Large language models (LLMs) raise a related question: can a model tell when it is likely to be wrong? Kadavath and colleagues at Anthropic reported that larger models were well calibrated on multiple-choice and true/false questions when the questions were formatted properly (Kadavath et al., "Language Models (Mostly) Know What They Know," 2022).
For open-ended answers, they had the model propose an answer and then estimate the probability that the answer was correct, which they call P(True). They also trained models to predict whether they "know" an answer, called P(IK). They reported that P(IK) generalized only partially, and that calibration became unreliable on new tasks.
That is a research result on specific 2022 models and tasks. It does not show that any current chatbot's stated confidence is trustworthy. A model saying "I'm 90% sure" in prose is not a measured probability. If you rely on LLM confidence, test it on your own labeled questions with a reliability diagram, as you would for any classifier.
Limits, privacy and security
Calibration is not a cure-all. The calibrator only learns the relationship in your calibration data. If real-world inputs change later, the fix can go stale. Re-check the reliability diagram on fresh labeled samples on a schedule.
It does not make a model smarter. It adjusts confidence, not knowledge. Documentation notes that a calibrated predict can differ from the uncalibrated one, because the top class is chosen from calibrated probabilities (CalibratedClassifierCV documentation). Isotonic can also create tied scores that slightly change AUC (scikit-learn guide).
Privacy. Calibration needs real, labeled examples from production-like data. Those may contain personal details, such as email text. Apply the same access limits, retention rules and consent checks you use for training data. Store only what you need, such as scores and labels, instead of raw text, where you can.
Security (my analysis, not a cited finding). Treat a high score as a signal, not proof. A deliberately crafted input could earn a high-confidence wrong answer, and a calibrator fit on ordinary data does not defend against that. For actions that are costly or hard to undo, keep a human review step and log the scores used for each decision.
Common mistakes
- Calibrating on the training data. The model's training outputs are over-confident, so the fix learns the wrong lesson. Use a separate calibration set or cross-validation.
- Reusing the test set for calibration. Your final numbers then look better than they are. Keep a third, untouched test set.
- Using isotonic on a tiny dataset. The documentation warns it overfits. Choose sigmoid, or collect more calibration data.
- Judging by accuracy or AUC alone. The scikit-learn example shows these barely move after calibration. Look at a reliability diagram and log loss as well.
- Trusting a Brier score by itself. A better score might come from a stronger model, not better calibration. Read the curve too.
- Using too many bins. Bins with a handful of samples give noisy curves. Lower
n_binsor use quantile bins. - Assuming calibration lasts forever. Data changes. Recheck on fresh labels.
Recap
- A calibrated model's scores match real outcome rates: items scored near 0.8 should be positive about 80% of the time.
- Accuracy does not guarantee honest confidence. Check a reliability diagram on held-out data, and read Brier score and log loss alongside it.
- Fit the calibrator on data separate from training. Use sigmoid for small sets, isotonic for large ones, and temperature scaling for multiclass models.
- Calibration mainly improves probability quality. Ranking metrics like ROC AUC stay nearly the same in the scikit-learn example.
- Calibration can go stale and handles sensitive labeled data. Re-check it regularly and protect the calibration set.
- Test any language-model confidence on your own labeled questions instead of taking it at face value.
Research Sources
- scikit-learn: Probability calibration (user guide, version 1.9.1)
- scikit-learn: CalibratedClassifierCV documentation
- scikit-learn: calibration_curve documentation
- scikit-learn: brier_score_loss documentation
- scikit-learn: Probability calibration curves (example)
- Guo, Pleiss, Sun, Weinberger: On Calibration of Modern Neural Networks (arXiv, first submitted June 2017)
- Kadavath et al.: Language Models (Mostly) Know What They Know (arXiv, first submitted July 2022)