How Much Electricity Will AI Use by 2030? Measured Data, Labeled Scenarios and Why Estimates Differ
Data centre electricity use has grown, but forecasts for AI differ widely. Compare measured data, per-prompt figures and labeled scenarios to 2030.
Many headlines say AI will "swallow the grid" or that its energy use is "tiny". Both claims can hide the real question: which numbers are measured, and which are forecasts? This article separates the two. It covers electricity use by data centres (the buildings full of computers that run AI), the energy cost of a single AI answer, and what researchers say about the largest training runs.
Everything about 2028 and 2030 below is a scenario, not a prediction. Scenarios show what could happen under stated assumptions. They carry real uncertainty, and the sources themselves say so.
Article index
- What has been measured so far
- What one AI answer costs, and why reports disagree
- Frontier training and the race to build
- Labeled scenarios to 2030
- Security and privacy implications
- A worked example
- Common mistakes
- Recap
- Research Sources
What has been measured so far
The best public baseline for the United States comes from Lawrence Berkeley National Laboratory (LBNL), a US Department of Energy lab. Its 2024 data centre energy report, published 19 December 2024, estimates past use back to 2014 from earlier studies and equipment shipment data. It also gives a range of possible futures out to 2028.
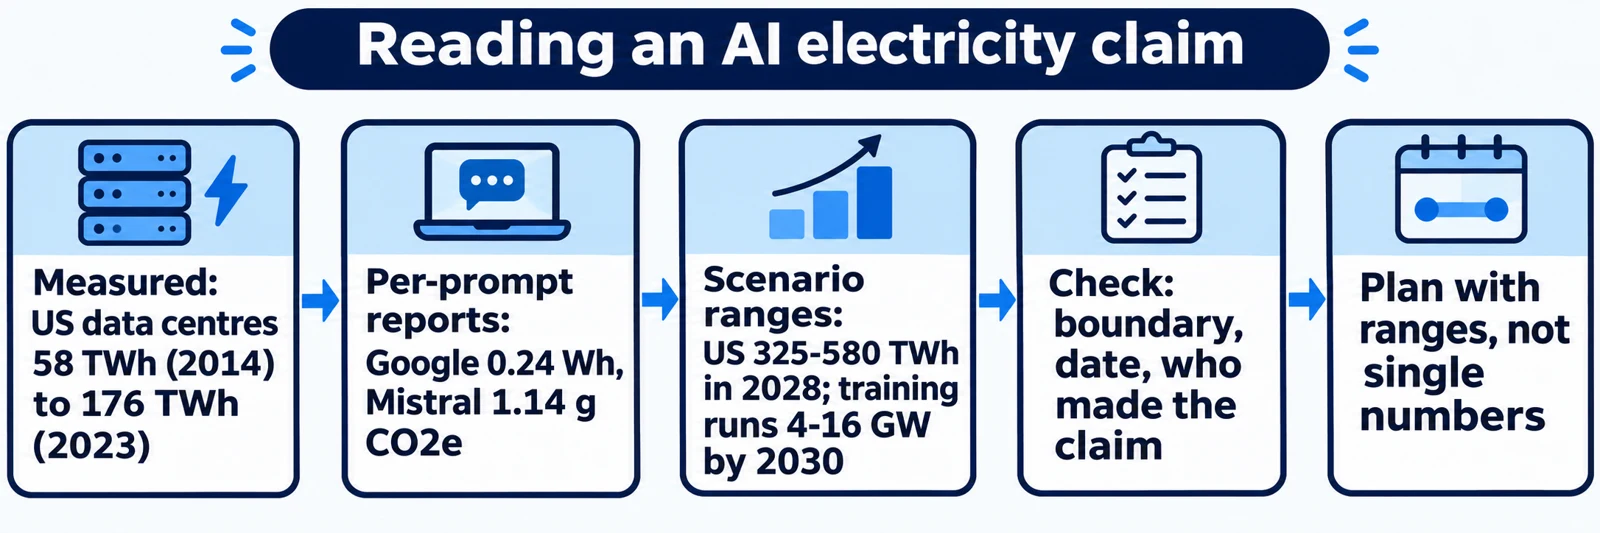
The Department of Energy's announcement summarizes the figures. US data centre electricity use rose from 58 terawatt-hours (TWh) in 2014 to 176 TWh in 2023, about 4.4% of US electricity. A terawatt-hour is one billion kilowatt-hours, so 176 TWh is a very large amount of energy.
These are estimates, not meter readings from every building. The DOE release also notes that AI is only one driver of rising demand, alongside factory growth and electrification. A data centre's electricity is not all "AI": it also runs email, video, storage and ordinary websites.
What one AI answer costs, and why reports disagree
A "prompt" is the text you send to a model. Two companies have published per-answer figures, and they differ a lot.
Google's research paper (submitted 21 August 2025, written by Google authors) reports that the median Gemini Apps text prompt uses 0.24 watt-hours (Wh) of energy and 0.26 millilitres (mL) of water. A watt-hour is a small unit: a 10-watt bulb uses 10 Wh in an hour. The paper says its boundary includes the chips, the host computer, idle machines kept ready for demand, and data centre overhead. It also reports a 33-fold energy reduction for the median prompt over one year. That is a company's own claim about its own system.
Mistral, a French AI company, published a lifecycle analysis on 22 July 2025, done with the consultancy Carbone 4 and the French agency ADEME and peer-reviewed by two other firms. For one 400-token reply (a token is a small chunk of text) from its Le Chat assistant, it reports 1.14 grams of carbon dioxide equivalent and 45 mL of water. Mistral calls the study "a first approximation". It says no standard exists for this kind of accounting and that a reliable lifecycle inventory for GPUs (graphics processors used for AI) is missing.
The water figures differ by more than 100 times. I could not establish the reason from these two sources. Possible causes, which are my hypotheses and not findings, include different system boundaries, different models, different reply lengths and different ways of counting water. Do not compare the two numbers as if they measured the same thing.
Frontier training and the race to build
"Training" is the long computing job that creates a model. The biggest runs use huge clusters of chips. Epoch AI, a research group that tracks AI trends, studied how large these could get.
In an August 2024 report, Epoch found that training runs of about 2e29 FLOP "will likely be feasible by 2030". FLOP means floating-point operations, a count of arithmetic steps. The authors note this is roughly the size jump from GPT-2 to GPT-4, and that it depends on labs being willing to invest hundreds of billions of dollars. They name power as the constraint most likely to bind first, followed by chip manufacturing. They give ranges from Monte Carlo modelling (repeated random simulation), not single answers.
A joint Epoch and EPRI paper (11 August 2025) estimates that the largest single training runs could need 4 to 16 gigawatts (GW) by 2030. Historically this demand grew about 2.2 times per year, and the biggest runs now exceed 100 megawatts. The authors also judge that more than 100 GW of AI capacity worldwide, and more than 50 GW in the US, is plausible by 2030. They add that it is "not certain" this much power growth is feasible, especially at the top of the range.
Building is fast but uneven. An Epoch data insight from 10 November 2025 found that tracked US sites took between 1 and 3.6 years to reach 1 GW after construction began. It said first GW-scale sites were expected in early 2026. That was an expectation at the time of writing; check Epoch's current database before treating any site as operating. Epoch notes its power estimates rely on satellite images, permits and a cooling model that may be off by up to 2 times.
Labeled scenarios to 2030
These three scenarios are my own framing of the ranges above. None is a forecast, and the sources do not assign them probabilities.
- Scenario A, steady build (horizon: 2028). US data centres land inside LBNL's range, roughly 6.7% to 12% of US electricity, which DOE describes as 325 to 580 TWh. Against 176 TWh in 2023, that is roughly 1.8 to 3.3 times as much. Uncertainty: the range is wide because AI hardware sales and usage are hard to predict.
- Scenario B, power-limited (horizon: 2030). Grid connections, equipment and permits slow construction, as Epoch's 2024 report suggests power may bind first. Frontier runs then fall short of the 4 to 16 GW range. Uncertainty: Epoch says it did not model supply bottlenecks in detail.
- Scenario C, efficiency offsets growth (horizon: 2030). Better chips and software cut energy per answer, as Google's 33-fold claim hints for one system. Total demand still depends on how many answers people request. Uncertainty: efficiency gains for one product do not prove an industry-wide trend.
What would change these scenarios? Watch measured data (utility filings, updated LBNL-style studies), build progress at named sites, and independent audits of per-answer figures. Treat any single forecast as one input.
Security and privacy implications
Energy numbers can look like pure engineering, but they touch security and privacy. The points below are my analysis, not findings from the sources.
Concentration. Epoch's work implies that frontier training could depend on a few very large sites. A few big sites mean a few big targets for outages or attacks. Distributed training across sites, which Epoch says is possible, adds network links to protect.
Measurement needs data. Per-answer reporting, like Google's, relies on internal usage logs. If you ask a vendor for such numbers, ask for aggregates only. You do not need prompt content, and you should not send it.
Cloud versus local. Running a model on your own computer avoids sending prompts to a vendor. It also moves the electricity use to you, and your hardware may be less efficient than a data centre. Neither choice is automatically greener or safer.
A worked example
This is an illustrative scenario. No test was run, and the company is invented. A small support team plans a chatbot that answers 10,000 questions a day. They want to estimate its electricity and water use before choosing a vendor.
- Collect published figures. Input: the Google and Mistral numbers above. What happens: you note each figure, its date and who produced it. Result: 0.24 Wh and 0.26 mL (Google, median Gemini Apps text prompt); 1.14 g CO2e and 45 mL (Mistral, one 400-token reply). Why it matters: each number has a source and a boundary you can name.
- Multiply by volume. Input: 10,000 answers per day. What happens: 10,000 × 0.24 Wh = 2,400 Wh, or 2.4 kWh. 10,000 × 1.14 g = 11,400 g, or 11.4 kg CO2e. Water: 10,000 × 0.26 mL = 2.6 litres versus 10,000 × 45 mL = 450 litres. Result: a range, not one answer. Why it matters: the water estimate differs by about 170 times.
- Check the boundaries. Input: each source's definition. What happens: you see Google's figure covers serving only for one product, while Mistral's comes from a lifecycle study of a different model. Result: the two are not like-for-like. Why it matters: picking the lower number because it is convenient would be a mistake.
- Adjust for your own case. Input: your answer length and model. What happens: you note that your replies may be longer or shorter than 400 tokens, and that neither company measured your system. Result: both figures become rough guides. Why it matters: your real usage may differ.
- Ask the vendor. Input: a short written request for energy and water per answer, with the boundary and date. What happens: the vendor answers, or does not. Result: a documented basis for your estimate or a recorded gap. Why it matters: you can decide using evidence and state your uncertainty in the report.
If a vendor cannot supply a figure, report your estimate as a range and say which sources it uses.
Common mistakes
- Treating a forecast as a fact. The 2028 and 2030 numbers are ranges from models. Write "projected" and give the source and year.
- Calling all data centre power "AI power". LBNL's figures cover all data centres. Check whether a claim covers AI only.
- Comparing figures with different boundaries. A per-prompt serving figure and a lifecycle figure answer different questions. Compare only like with like.
- Trusting a vendor's own efficiency claim alone. Google's 33-fold figure is from Google's authors. Look for independent checks.
- Assuming past growth continues in a straight line. Epoch itself says the upper end of its range may not be feasible.
- Ignoring dates. Several sources here are from 2024 or 2025. Newer data may exist, so check for updates.
Recap
- Measured: US data centre electricity use rose from 58 TWh in 2014 to 176 TWh in 2023, about 4.4% of US electricity, according to DOE's summary of the LBNL report.
- Scenario: the same report gives 6.7% to 12% of US electricity by 2028. That is a range, not a forecast of one outcome.
- Per-answer figures from Google and Mistral use different boundaries and should not be compared directly.
- Epoch's estimates of 4 to 16 GW for the largest 2030 training runs are modelled scenarios, and the authors doubt the top end is certain.
- Always ask: who measured this, what is included, what year is it, and what would change the answer?
Research Sources
- Lawrence Berkeley National Laboratory: 2024 United States Data Center Energy Usage Report (publication page)
- US Department of Energy: DOE Releases New Report Evaluating Increase in Electricity Demand from Data Centers
- arXiv: Measuring the environmental impact of delivering AI at Google Scale
- Mistral AI: Our contribution to a global environmental standard for AI
- Epoch AI: Can AI scaling continue through 2030?
- Epoch AI and EPRI: Power demands of frontier AI training
- Epoch AI: Data centre build-out speeds (data insight)